Friday 26 December 2014

Sector Reviews after X'mas Rally

Dear SGWiseInvestors Fans and Readers,

Merry Christmas! The Christmas rally as predicted did come true. Now the market is experiencing low volume rally to the New Year. Emails received asking if when can they short the market. Not now. The price action and volume indicate we will have the rally till next week. There is no selling climax behind the scene thus we can expect more rally to come. RSI and price action indicate that there is still room for more upwards and momentum of the trend is strong. 
Market Level

INDU – DOW Jones
Going up?


NASDAQ

Upward trend?Nasdaq is now at the support of the RSI at 57.85. We can see that it is moving sideway. We hope to see the trend curling upwards to indicate more momentum. MACD is indicating that there will be a crossover. This meaning BUYING SIGNAL will be triggered for MACD users.  We forecast that the Nasdaq will breakout at 4800 and more upward movement in weeks or even days to come.


Sector level

From the graph that we attached for the overview of the market sectors. We can say that the strongest is utilities. Energy sectors is not a pick now. From the chart below, there is a high chance that it will not bypass the 200SMA hurdle. We should see it going down soon unless volume is there to push the prices higher. Health care looks good as it has met its support at near 200SMA and this seems like it is rebounding to higher high soon. Material is having a Doji which means that there may be no buying coming and may see a retracement soon for buying to comes in. The rest of the sectors looks promising .. every dip is a buying opportunity.


Reviews on 26Dec14

BABA – Alibaba


This stock is at support near 50 which is currently at 48.03. Moreover it is now at 50MA support.
This week is a crucial week for BABA as whether it will pop up or go down to below 100. We reiteriate bullish view on BABA. MACD  is looking to crossover and we will need that to move higher. This stock has been consolidating for months and it looks like it is ready to move with YHOO moving up as well.


YHOO - Yahoo


Consolidating since Mid November and RSI shows that support is at 50dollars. MACD is not crossover yet.Volume is low as it is festive month and traders are not actively trading. If this week we see MACD crossover or a spike up in the price, this stock is likely to breakout and should see 60 soon. 
In Trading, I learned cause and effect. If there is consolidating sideway (accumulation in this case), we should see this as a strong support and moving higher gradually.


WUBA – 58.com


This stock is a buy if the price shoots above 200SMA 43.50. Currently is is consolidating sideway. This is maybe due to MOMO selling pressure that leads to decline in BABA and also WUBA. MOMO selling pressure seems to be ending and this few days we saw Smart Money moving in. Thus we should see it moving real fast and moving towards 20 soon.


QIHU – QIHOO360


This stock is very volatile and looks good to move higher. RSI indicated that the stocks is gaining momentum and is likely to zoom past RSI 50 hurdle. MACD indicated that that buying is in place. 
Volume increases as prices is going up. We should see this stock meeting  72 high as first hurdle. 
With its acquisition of Coolpad and also the implementation of Voip we should see it gaining strong market cap for mobile sector. This is a BUY!!


FB – Facebook


Facebook has been moving strongly upwards lately. This stock has abit of selling pressure on Wednesday. Next candlestick is indication of resume of upward trend or selling comes. We should see it consolidating sideway. It seems to us that there is more room for upward.


TWTR - Twitter


This stock is currently near support at 45.26 RSI. This stock has abit of selling pressure on Wednesday. Next candlestick is indication of resume of upward trend or selling comes. We should see it consolidating sideway. It seems to us that there is more room for upward. MACD has crossover, indicating that it is buying that is underway.


APPL – Apple


This stock is currently at support. It is consolidating sideway at 111-112 range. Low volume is indicated with dips. Thus we should see this supported and there is more room for upward. 50MA has been a strong support and this will be a critical support. 


GPRO - GOPRO

Love this stock. This stock has been on the strong uptrend. Within 3 days, it moved up more than 10 dollars.we should see it moving toward 70. Volume indicated that there are more upside. RSI indicated that it is moving upwards and MACD has just crossed. We should see this meeting 80 in months to come. 

Friday 19 December 2014

Technology Sector For Past Few Days

Company Level


NE Noble Drilling


This stock will rally to at least 18.69. If volume is to come in, it will hit 24.35 and reverse downwards. Do note that the crude oil issue is not resolved yet.  That will result in one last leg to tank until I can see further confirmation.


NBL – Noble Energy


This stock will rally to 51.93. If volume is coming in, we will see it test 66.65. Given the time of the rally, we can expect volume to come in and push the price to test the 200MA.


Technology


AAPL has hit the low of about 104 and reverse upwards 109.41. With volume coming in high we should see this testing 115 soon. Watch! We should be there by month end.


BABA- Alibaba


BABA has been moving sideway and bounce off the low at 50SMA. We should see the stock testing 120 soon with the christmas rally now. RSI has indicated that there are more room to the upside.

Market Condition

Dear SGWiseInvestors Readers and Fans,

Sorry if the blog is not updated daily as I have been observing what the Smart Money is acting behind the scene. I observed on the thanksgiving day that there are offloading of equities. But on short term trading methodolody, it will be bullish till end of the month. We may even hit all year high by Jan 2015. In our previous blog, we indicated that this week is the crucial week and will likely see the reversal after the speech by FED, Yellen on Wednesday. Indeed yesterday rally is impressive with 213 points gain. Momentum is up and there is a lot of buying with volume going higher. There is not much selling judging on the upper wick of the candle. 

Fans from Stocktwits came and ask me for my opinion on the market. If you read my blog regularly, it was written black and white that Wednesday or Thursday is the reversal day.  Indeed it came true and you will know the accuracy that we have in the stock market. Investors have to obey the rules and not let your emotions run wild (talk is easy but this comes with clear mind and trading discipline which may takes years to cultivate). Today is also a good time to enter the stock market as the run will last till Jan 2015. 


From the below chart/diagram, we can see that the one that is currently the market is more bullish in Nasdaq than Dow Jones. Thus we will look at the top runners yesterday later and we will be able to distinguish the leading company for yesterday ‘s run. Those that rally the most yesterday will be the one that continue to rally more than other companies today (*normally).


Sectors


We have attached the above charts for your analysis. We can see that all the industrials have hit the support line and followed by white candle. Yes we are going for the bounce. The selloff in Energy sector recently has led the Dow Jones. This is the leading sector for yesterday. Cyclical, Material and Health has been holding up well and they are the sectors that did well yesterday. The second diagram shows the period from 06 Mar 2014 to 17 Dec 2014 of which sectors perform the best for LONG TERM Investors.


From the above diagram, we can see that TOP 5 is as follows. We have to look in further to see if this are the stocks that we can put it in in short term.

Tuesday 16 December 2014

Forecast for 16Dec14

Dear SGWiseInvestors Reader and Fans,

Last week and yesterday has been a volatile week. Readers have came back and ask me if the market is going to tank or is it a buying in dip opportunity. Seriously based on my 10 over years of experience this is a buying in dip opportunity. Why? Gold is a safe heaven commodities and is a good gauge for fear. When the market is about to tank, have used this tools "Fibonacci Retracement" to determine the support and buying pressure that may come in. Yesterday was a test of 61.8% support at 17,169. There is selling pressure that pushes the market to low of 17,115 and closes at 17,180. If today the market holds at this support (which is unlikely), we should be heading up for a rally. 
I believed that we should be testing at 50% support 16,915. I can see that RSI is indicating that there are still some room for one or two more falls and we are heading for Christmas Rally. I do note there will be FED meeting this Thursday and this may be a triggering point for the rally. FED may announce something doverish to boost the market and to lure more traders into the market. (they cannot possibly scare all investors out of the market, then how are they going to make money). 
I do notice that Dow Jones are now heavily linked with Crude Oil. There is no need for any good/bad news to be catalyst. If the Crude Oil rebound, the stock market will re-live. But whether if it is short lived or not, let the volume tells you.

Dow Jones – Where are we heading?


CLF15 – Light Crude Oil


Commodity Crude Oil is the culprit for bringing down the whole stock market. The above chart show a nice downtrend since 06 Oct 2014. This is accompanied by increase in volume. Technically this means that there are genuine selling by Smart Money and they have not seen the price that they want yet. Thus there is no rebound or up candle stick. Target Price for Crude Oil should be around USD48. That will be one big strong support that we are looking at. Currently we can say that downside are more favourable in the short run until good news/ announcement comes in.  


Gold – Is it heading North or South?


Gold from the above chart shows that it is currently on the uptrend. This is probably due to increase in fear from Crude oil commodity bringing the stock market down. Yesterday decrease of about 29 points is currently in the support of 30SMA support. We should see absorption volume coming in at this point if the upside will to resume. Else we should see it retesting 1140 soon.


Daily Chart and Weekly Chart for $Brent is attached. Currently the daily chart and weekly chart is showing that it is overbought. There is no floor yet thus there is no indication where is the bottom. Yesterday increase in volume in selling indicated that there are a lot of people selling their shares. We can say that there are increase down pressure as indicated from the volume. Whether when will we reach the bottom, only volume and price action will tells.

Wednesday 10 December 2014

Reviews for 09Dec2014

Dear all fans and readers of SGWiseInvestors,

Yesterday is a super day for Traders as we witness continuation of selling of energy stocks that led to Dow loss.  Gold which is a gauge of sentiment for fear inches up and closed at 1,229. NASDAQ closed on positive note. Penny stocks lead the Dow and trims the loss and closed at 51 points. We can see that although there are no reversal yet but we can say that there are buyers at this support level at 17,801. We will have to see today’s candle to confirm on the reversal or continuation of the ST downtrend.


From the above chart, we can say that there are absorption volume at 17,600 and this is a big support at the moment. This is accompanied by high volume and believe that today will be a higher probability that market will be going higher.


XAU - Gold


Is Gold heading up or down? Gold increased the past few days and I did indicated earlier on that Gold is going to soar to around 1221. However, we can see the increase in volume. This shows that the fear of the oil issue is not over yet. We may expect some news soon. We should see gold testing 200SMA at 1271. If the increase in volume persist, then we should see it test 1300 in the near term.


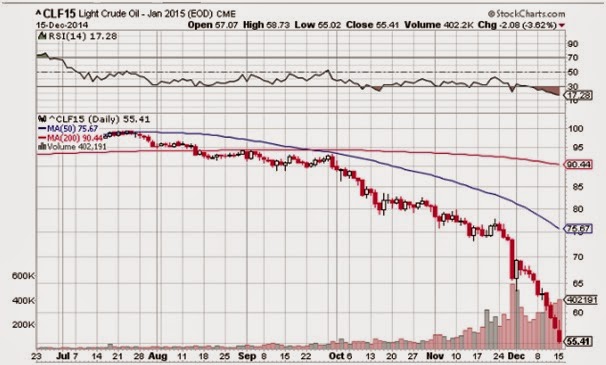
Brent – Brent Crude Oil


What happened to Brent Crude Oil!? It's heading downwards again? Yesterday we witness bounce in $Brent and this led to Dow Jones trim its loss. Will we see it bouncing up? The chart is not looking good and yesterday bounce is accompanied by only average volume. We hope to see more volume coming in and this may lead to reversal. At the meantime, any bounce is for more short. We may see the bounce to 76 to close gap and thereafter further downtrend to continue.


China Stocks round-up
WUBA - 58.com


Emerging buyers! Let us touch on the first stock, WUBA. This stock is likely to bounce higher. This stock dip to below 42 and closed with a white candle on the upper wick. The only worrying about this stock is there is no high volume during the absorption. Thus we have to wait on wed closing candle to determine if this is a buying signal.


BABA – Alibaba


If you did follow our post for BABA, you will be able to link them all together. And now, is this a buy signal for us? This stock has found support at 101.25 and bounce off, closing at 107.48. The volume shows increase in buyers. The candle body is wide and this shows the bullish sentiment of the stock. We believe that the stock has reversed and is on the way to higher high. The first resistance is at 110 and subsequently is 115. If the stock is bullish enough, this stock will test 120 in no time and making ALL time high.


Qihu – Qihoo


This counter is going to bounce like on a trampoline? This is a counter-trend approach. Meaning to say, the stock is currently in the downtrend and traders are targeting fast profit. This kind of risk is higher as traders are catching falling knifes. Predicting the bottom. But if the prediction is correct then this will a huge profit for the risk taker.


FB - Facebook


What about Facebook? Can we buy now? One of my followers in Stocktwits ask me about this stock and whether if it is time to enter. The answer is NO. There is no buy signal yet. Investors who is afraid to lose boarding the train and do not mind locking their funds can buy in this stock at support price 72-74 range. For Breakout trade, look for about 78 to enter. Do note volume must be high (about twice the current volume).


TWTR – Twitter 


Another counter-trend play. This stock is currently in the downtrend. Yesterday price action has indicated that bottom has reached. The support is at 34.62. It closed with wide body and at the upper wick of the candle stick. Volume is quite decent. If volume is to come in, together with more buyers, we should see it closed gap at 46-48 before continuation of the downtrend.


AAPL – Apple


Has APPL reached the support required? One of my followers in Stocktwits ask me about this stock and whether if it is time to enter. The answer is YES. There is buy signal yesterday. Bottom/ support is at around 110. If the stock is closing on a positive note today, we can expect this stock to gain strength and test 120 once day.


TSLA – Tesla Motors Inc


Heading up or down at the bottom? Support is at 205 and we should see this stock bounce to around 231-240 and downtrend will resume. Unless we see buyers coming and increase in volume. Else we should see more downside for this stock.

Dow Jones Roundup – 09 Dec 2014

With the available source and data provided by StockCharts, we can see that Dow Jones has moved from “ Improving” to “Leading”. This means that there is an increased in bullishness and Dow Jones is gaining momentum. This is likely because of large cap moving/bouncing off the support/bottom. We can see the changes % at 4.7. Nasdaq is also doing well but it is losing momentum. Thus investors can still hold on to their current position as we predict that market is turning bullish soon.


Worst Sector?


With the plunge in $Brent last Friday, this led to sell off in the Energy stock. Other sectors doing well includes Technology, Cons. Staples, Health care, Utilities and Financials. The increase in momentum in Financials could be due to the better than expected Non-Farm payroll data. Traders are expecting a hike in USD coming in before March 2015. Thus Financials should be short-term bullish till further confirmation from FED. We did publish out  yesterday that there are also a lot of IPO Tech stocks that will be issued Dec 2014. Thus with that in play, we should see Tech stocks moving in correlation with IPO technology stocks. 

Tuesday 9 December 2014

Monday Dow Jones Market

Hi Readers and Fans of SGWiseInvestors,

Thanks for reading the blog material and let me do a run through of the Monday Dow Jones market.
Just a reminder to all readers who have not signed up with our closed group Facebook member, please do so. I am at the midst of finishing up trading materials which I believe will build a good foundation of what trading skill you have. This is only complimentary for our closed group member.


Monday Dow Jones Market

Stocks suffered their biggest one-day slide in nearly seven weeks on Monday as a withering sell-off among energy companies, which closely tracked oil’s continued price slide, dragged down key benchmark indexes. 

Downbeat economic reports from China, Japan and Europe also dented sentiment. Nervousness among investors was evident from a jump in 10-year Treasury yields, rising five basis points and a 20% jump in the CBOE VIX index, commonly known as Wall Street’s fear gauge.


This pullback is long expected as RSI has been overbought since 17 Nov 2014. This pullback is met with support at 17,800. If the market is to pullback further, we will see it approaching 17,600 support. 

Readers of all sources are asking me about the outlook of the market. I remain short term bullish. This is basically a buy in dip opportunity for traders. The Short-Term Uptrend and Long-Term Uptrend are still intact. Unless we see a breach in support line and this will be our confirmation if the uptrend line will still resume.

There are a lot of IPO stocks that will be launched this month. There are three prominent Tech stocks like Lending Club (NYSE:LC), MOMO (NASDAQ: MOMO) and also Workiva (NYSE: WK).

1) Lending Club is online network that connects lenders with borrowers. It is offering 57.7mio shares at price in the range of 12 to 14. Investors includes Lending Club is GOOGLE.

2) MOMO is platform for dating activity but is also used to help people find new friends. This is reported to be the third largest mobile social app in China behind Wechat and QQ that are owned by Tencent.  Investors includes ALIBABA and 58.com.

3) Workiva is a cloud-based and mobile-enabled platform companies that use to collect, analyse and manage business data. Customers include Boeing, Google and Wal-Mart.

Saturday 6 December 2014

Bio-Tech and Financial Counters Review

PRQR – ProQR Therapeutics BV


This stock breakout out away from resistance 18. Increase in the body, closing at the upper wick proved that this stock is very bullish at the moment. We should see it going higher in no time.


TMO - Thermofisher


This stock is accumulating at the upper side of the trend. There are absorption volume and this proves that there are buying at 127 level. If it happened to reach 127 again.. this is worth a consideration as this has high probability that it will break out soon.


C - Citigroup - This is rising 


We gave a buy signal when it is at 53-54 range. This stock is soaring yesterday. It break out with good volume and this indicate that we should see it going higher. Target price should be 60. we will monitor this. Remember Financial sector is now one of the leading sector and it is worth a look .


JPM - JP Morgan


JPM had also breakout with good volume. Island candle yesterday. We should see higher high coming in days to come. Target price should be 65.If volume comes in strong, 70 is reachable in short term. Watch!


BAC - Bank of America

 
BAC is the strongest of the three financial counters we reviewed. A full white body with that high volume indicated that all buyers are holding to the stock. We should see this stock moving high. 18-18.5 is the target price. We should see this in days to come.

Technology Counter Reviews

BABA - Alibaba


Is Alibaba a sinking ship now? The stock is temporarily bearish. It is moving sideway for the meantime. The increase in the body and the increase in volume has shown that more downside is expected. We may see a test to 103.90 coming. Do note that that MOMO IPO is coming on 12 Dec 2014. I believe that this dip is for more passengers to board it before it moved to next destination on the uptrend.


WUBA - 58.com


Yesterday I was so excited by the performance of this stock. It is soaring. However the overall performance is bearish. Why? because it closes mid to lower of the wick. Looking at the volume there is not much shares changes hand and below that is purely marked up by retailer. I see it moving higher with increase in volume. 


Qihu - Qihoo


Going downward? This stock has been underperforming after the 3rd quarter earnings report? when will it go up?
I am seeing this turing soon. I want to see a bullish candle and this stock is due to reverse. why do i say it will reverse. Simple - look at the volume. It is moving to lower low with decrease in volume.There is lack of participation from Smart Money. Every dip there is a wick. This is showing that there are buying at the backscene. We should see this testing 62.50 and we will see the reverse. 


INTC - Intel and MU - Micron


Both are inching higher and higher! These two technology stocks are moving higher. There may be pullback due to lower volume. But I believe this stock should see new high and increase in bullish sentiments.  


FB - Facebook


Yesterday is a buy signal triggered for FB. We can see that 10SMA and 30SMA has crossed. Increase in volume has proven that the move upwards is genuine. This stock will test 78 and soon hit 80 to close the gap. Next week is still not late to go in. Watch!


TWTR - Twitter


Nice uptrend from TWTR. We can see that the 10SMA and 30SMA is crossing as it narrows.
We should see volume coming in at slightly below 200SMA 44.10. It has to create a breakout in order to surpass the resistance to fill up the gap 48.

Recommended price:
Buy at 44.11 (support)
Target is 48
Stoploss is 44.


AAPL – APPLE


We saw a dip in APPL. Is this falling? There is no much movement as it is showing that it is between the Trader Zone (between 10SMA and 30SMA). We will like to see bullish candlestick here. As long as the uptrend is intact, this stock remains potential to break 120 in time to come.