Hi all,
Thank you for the continual support. If you have any enquiry, kindly email to us at the below address:
sgwiseinvestors@gmail.com
Regards,
SGWiseInvestors
Tuesday, 3 March 2015
Monday, 9 February 2015
Counter Reviews for 09Feb2015
Dear SGWiseInvestors Fans and Readers,
Lets round up some of the other stocks as well.
AAPL - Apple

This stock has a good run after the good news. Where are we heading? The last Friday bar is a bearish bar with high volume. Monday price action is very important to make the next forecast for this stock. The volume is showing that a pullback is highly likely. Why? Make a comparison between last high and this high. You will notice that there is no much catalyst to push this stock higher.
VLO - Valero

We should see this breakout soon. But at the meantime I should see some pullback. It is gaining strength. There are buying in the down bar last Friday. We should see this breaking out soon.
BIDU - BAIDU

This is one stock that you should avoid now. Looking at the last bar, it is supper bearish. It will hit 200SMA and may even break. Resistance level is at 195. Thus we should see this likely to bounce at that level.
QIHU - Qihoo

This China Stock is currently the strongest of all. It has passed 50SMA, heading towards 77.41 which is the 200SMA. This is definitely a buy at the moment.
WUBA - 58.com

This is one stock that you should avoid. It is not moving anywhere. Side-way consolidating only.
Interested buyer can buy at price 36 for short term gain.
GOOG - GOOGLE

This stock is likely to move higher with the big candle stick and also 50SMA as the support. We should see this stocks closing near 549. Volume has to come in to validate this move upwards.
FCX - Freeport McMoran

This stock is a no-touch stock. It is on a downtrend and every rebound is weak. From the RSI, we can say that this is moving down further.
NEM - Newmont Mining Corp

This stock is a BUY. Every dip, you can see it comes with a BUY. Support is at 23.04. Any break on that we should see it dip to about 22. We should see this going higher in the near term.
MSFT - Microsoft

This stock is on short Term uptrend. Volume has to come in to pass 43. At the meantime, this stock is not likely to surpass 43. Not a good punt on this stock.
SNDK - Sandisk Corp

You can buy this stock at 75 for longer term investment. It will be going down soon to retest 75 before any bounce. I believe that there will be support and a lot of BUY awaiting at 75.
GE - General Electric

This stock is moving down. Friday bearish bar confirm this.
This stock is worth a SHORT! This should go back to 23.50.
GM - General Motor

If the stock is down on Monday with increased volume. This stock is worth to short as well. Keep this stock in your radar.
GILD - Gilead Sciences Inc

Buy? Not yet. Do note of the 200SMA and see if there is any rebound? Else this stock remains a SHORT stock.
Gold - Randgold Resources Ltd
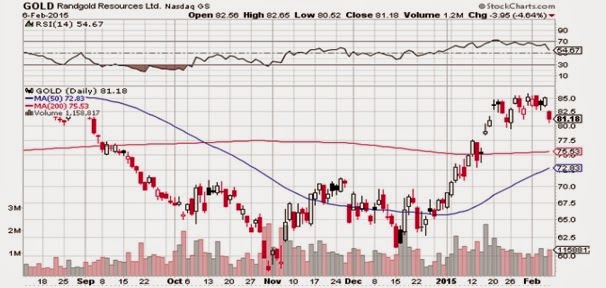
GOLD will likely dip to 75.53 which is 200SMA before any continuation of uptrend. Do keep this in your radar as well.
LNKD - LinkedIN Corp

This stock bounce to high of 272 and close at 263.40. The volume is exceptionally high which means a lot of people is offload and onloading. Monday price action of whether further uptrend or downtrend will be concluded.
Sunday, 8 February 2015
Forecast for upcoming week
Dear SGWiseInvestors Fans and Readers,
Today I will cover the stocks and see where they are heading this coming week.
BABA - ALIBABA

Where are we heading next? BABA has been on the declining downtrend since 26 January 2015. RSI indicating that it is now at the oversold area. Volume is decreasing as the stock moved lower. This stock is close to support at 83. We should see this bounce any time soon.
YHOO - YAHOO

YHOO are open to more downside? YHOO has been moving lower since ALIBABA reported bad news on the28 Jan 2014. Although there are aborption volume but it seems like it is not enough to push the stock higher. 42 is the current support. We should see this going to worst case scenario at 41.16 before the stock will move higher. Do note it is still on Long term uptrend
INTC - INTEL CORP

INTC going down? INTC is supported at SMA 32.45. It should be going to test 42.45 support. This is a critical support. Once break we should see it testing at 30
MU - MICRON

MU seems to consolidating sideway right now. This stock is currently supported at 28.91. We should see this testing support at 28. Once any confirmation of no supply bar (please read VSA guide) or absorption volume we should see this testing resistance at 31.52.
NFLX - NETFLIX

NFLX is consolidating as well. This stock is currently consolidating at the top. With RSI at overbought area, we should see this falling off the cliff to fill up the gap at 380 soon.
TSLA - TELSA MOTORS

This stock is perfect for shorting. This stock has closed off at the lower wick on the 05 Feb 2015. We should see this testing 214 resistance. Once break, we can see this moving to 190 which is a strong support.
TWTR - TWITTER

TWTR is resuming uptrend? Yes Yes we are heading to the top for TWTR stock. We should see this heading to resistance at 54 soon. Although it is now overbought. With this kind of momentum I believe this will sustain a while before heading down.
BAC - BANK OF AMERICA

BAC going higher? Likely. We see the stock hitting SMA 16.77 and moved lower , closing at the mid of the wick. I believe this stock will be moving higher. There may be small dips but on the short term it is bullish.
GRPO - GOPRO

GPRO is heading down! This stock is moving down. It is closing at the lower wick with high volume. Buyers are offloading this stock. We should see this to below 38-40 at times to come before it bounce up again.
C - CITIBANK

C seems to be testing the support. This stock is not moving up. meet resistance and then closed with lower part of the wick. It will move down to test the support at 47.
JPM - JP MORGAN

JPM as well is testing the support. This stock has meet the resistance at around 49 and we are heading down to the support once again.
DAL - DELTA AIR LINES

DAL is going up or down? We are likely to see this moving down gradually to 44. Once break, we should see this moving to 40.72.
WMT - WALMART STORES

WMT is moving up? No we are moving down. The stock has a bearish price action. It is closing at the lower part of the part. volume is not high, I doubt we can move above the resistance. We should see this moving to 84 soon.
AMZN - AMAZON

For this stock, are we still seeing it go higher? I will bet this on the downside. Why? Using price action you can say that this is a stock with candle closing at upper wick. However look at the volume, this is not a valid move. Its abnormal. With RSI at the overbought, I believe it will consolidate and move lower in the ST.
Forex Forecast
USD/JPY
This is one of the VSA software that I strongly recommend. This is on the Friday’s chart for USD/JPY. Just before the News for US Job is announced, the system has alert that that are “Smart Buying” – which is the blue dot. It also has the function to measure all the Bullishness and Bearishness of the different Timeframe. It really saved me a lot of time to analyse and also to switch to different timeframe.
Imagine this software and look at the profit that you will gain just following the software. You gain at least 200pips in this trade. What is the initial cost of USD450 for whole licensing and all software updates? This is realty a cheap steal and great deal to have.
The decision is yours!

USD/CHF
This is my pick that this is likely to resume higher next week. I can see that there are two Smart Buying as alert by the software. Under the H1, blue indicate that it is bullish. On the Longer Timeframe, H4 is also bullish. We should see this going higher and if there is any SMART BUYING I am in for this trade.
On the lookout!!

Introduction to Volume Spread Analysis (VSA)
You have heard of Volume Spread Analysis and the value it might add to your analysis. But it sounds like a convoluted trading method with uncommon terms like “No Demand Bar” and “Stopping Volume”.
Is VSA really that inaccessible?
Together, let’s take the first step to understanding VSA.
With this guide, you will find that VSA is an intuitive method after all.
WHAT IS VOLUME SPREAD ANALYSIS (VSA)?
VSA is the study of the relationship between volume and price to predict market direction.

In particular, it pays attention to:
• Volume
• Range/Spread (Difference between high and close)
• Closing Price Relative to Range (Is the closing price near the top or the bottom of the price bar?)
WHO INVENTED VSA?
There are three big names in VSA’s development.
• Jesse Livermore
• Richard Wyckoff
• Tom Williams
Jesse Livermore spoke of a theory based on market manipulation. He also worked his theory in his legendary trading career. However, he did not pass down concrete trading methods. His legacy is that of a trader and not an educator.
Richard Wyckoff was much more interested in education. To find methods that work in the markets, he interviewed top traders including Jesse Livermore. Wyckoff proposed the idea of a “Composite Trader” that embodies the entire market. He used the “Composite Trader” to explain the market phases of accumulation, markup, distribution, and markdown.
Neither Jesse Livermore nor Richard Wyckoff used the term “Volume Spread Analysis”. It was Tom Williams who used the term to describe the methods he built based on the Richard Wyckoff’s ideas. Tom Williams’ books and software has helped to propel the concepts of VSA among traders.
WHY DOES VSA WORK?
The basic idea is that the public can only make money from the markets if we understand what the professional traders are doing. And professional traders are not small players. They play big.
Hence, they leave their footprints in volume data. When the professionals are active, the market shows high trading volume. Conversely, when the market volume is low, the professionals might be holding their horses.
It follows that in order to get a sense of what the big guys are up to, looking at just price action is not enough. We need to look at price together with volume.
DOES VSA WORK IN ALL MARKETS?
VSA focuses on price and volume and seeks to find the actions of professional traders. Hence, as long as a market has a group of professionals and offers reliable price and volume data, the trading premise of VSA holds.
Almost all financial markets (stocks, futures, forex) seem to fit the bill.
However, in the spot forex market, volume is a tricky concept. You will not get actual traded volume. You get tick volume which measures the times the price ticks up or down. If you intend to use VSA methods for trading spot forex, you need to decide if your source of tick volume is a reliable proxy for actual volume.
HOW DO WE USE VSA TO TRADE?
I will not sugar-coat the fact that VSA is difficult to master. This is because traders have interpreted various VSA concepts differently. To trade well with VSA requires years of practice and market observation. (Consider how much time Jesse Livermore, Richard Wyckoff, and Tom Williams spent studying the markets.)
Nonetheless, we can still improve our trading with basic VSA concepts that are easy to understand. Hence, in this first guide, we will look at two simple VSA concepts.
• No Demand
• No Selling Pressure
VSA BASIC CONCEPTS
1. NO DEMAND ON UP BAR
If the market rises with contracting spread and volume, the market is not showing demand. Without demand, it is not likely to continue rising.
To find “No Demand” bars:
1)Price closed higher than the previous bar.
2)Volume is lower than past two bars.
3)Spreads (Range) are narrow.
2. NO SELLING PRESSURE ON DOWN BAR
If the market falls with decreasing spread and volume, the market is not interested in selling.
Thus, it is not likely that the market will continue to fall.
To find “No Selling Pressure” bars:
1)Price closed lower than the previous bar.
2)Volume is lower than past two bars.
3)Spreads (Range) are narrow.
VSA TRADING EXAMPLES
In the two examples below, we will use a 20-period simple moving average as our trend indicator. Our aim is to use the concepts of “No Demand” and “No Selling Pressure” to find trend retracement trades.
In the charts below, I have marked the “No Demand” bars with red arrows and the “No Selling Pressure” bars with green arrows. (Click on the images to zoom.)
1. NO DEMAND BAR – POTENTIAL SHORT TRADE

This chart shows the daily bars of Deere & Company (DE).
1)This bar punched below the SMA and hinted at an impending bear trend.
2)These three consecutive “No Demand” bars confirmed the lack of market interest to resume the bullish run.
3)Hence, we had a great context for considering a short trade.
2. NO SELLING PRESSURE – POTENTIAL LONG TRADE

This chart shows the daily bars of The Proctor & Gamble Company (PG).
1)The market was in a strong bull trend and remained above the SMA.
2)In this sideways pullback, we observed three “No Selling Pressure” bars.
3)They hinted that the bears are not forthcoming, and the stage for a bullish retracement trade was set.
4)This bullish Pin Bar offered the ideal setup bar.
WHERE CAN WE LEARN MORE ABOUT VSA?
VSA is gaining in popularity, and there is no lack of resources to advance your understanding.
But I am sure that no software will bring you trading success unless you truly understand the VSA principles. Hence, you should definitely learn as much as you can about VSA, before relying on a software for your analysis.
RELATED VOLUME STRATEGIES
These are not classic VSA methods, but they will help you understand the interaction between price and volume.
1)Low Volume Pullback
2)Low Volume Pullback (Expanded)
3)Anchor Bars
4)On-Balance Volume
CONCLUSION – VSA
Volume is valuable because it offers another market dimension for analysis. Volume is also dangerous because it confuses those who do not understand it.
Take one step at a time. Pick up VSA concepts steadily and use them in your trading prudently. Once volume starts to make sense to you, you will see progress but improvements will not come overnight.
CHECKLIST FOR VOLUME SPREAD ANALYSIS - SHORT NOTES
Volume Spread Analysis – look into volume, spread and close. we will also keep in mind the general background of the market.
Checklist
The best entrances within a trend is when we see a no supply (within an uptrend) or a no demand (within a downtrend). Why? The professionals (market makers and syndicates) want to test for professional interest in a given direction. The tests (no supply, no demand) give us an idea of the supply/demand balance and professional interest and that's what we're looking for to determine strength and weakness.
No supply: A bar that goes up, yet closes off its highs and has lower volume than the previous 3 bars.
No demand: A bar that goes down yet closes off its lows and has lower volume than the previous 3 bars.
Checkbook for going long:
1. Higher highs/lows
2. No excess supply coming in.
3. No supply
Checkbook for going short:
1. Lower highs/lows
2. No excess demand coming in.
3. No demand
Exits: Excess supply/demand coming against you on lower TF's or ND's/NS's in the other direction.
Notes taking from PDF files from Volume Spread Analysis book.
The SM basically moves the market in four phases as follows
1. Accumulation
2. Mark Up
3. Distribution
4. Mark Down
1) One of the most important characters of congestion areas is the Low Volume. When most traders are bullish or bearish the volume is high.
2) Accumulation area: a)Indecision should be visible. b) volume should be narrow. (low and quite). No huge upsurge. c) The spread of the bars(High-Low) should be narrow. d) Volume should shrink near the support line and expand near the resistance line. f) check on the volume pattern as well.
Breakout
The volume need not be very high at all.
Since there is no supply (SM have the majority of the floating stock).
If the volume is moderate we should see it coming in strongly soon. Otherwise the move will collapse and stock would return to the base.
We should see a large swift increase in the volume in case of a genuine breakout.
The stock should be closing near the top. Also too much volume is not good. It would mean too much supply is coming in.
Heavy volume with the stock closing in lower half would definitely mean supply coming in. Typically an 150% increase in volume with the close near the top would indicate a successful breakout.
The breakout is just the beginning. Then the stock moves up in stages.
Each stage would be an advance at higher volumes and a retracement at lower volumes.
The end of downtrend is generally indicated by a stopping volume or an absorption volume. The
SM may be absorbing the stocks to start the game again. You would find a High volume bar with long spread and closing near the top.
Upthrust Bar
An Upthrust Bar is a wide range bar, with a high volume and closing down ( towards closing hours).
Upthrusts with low volume - I call them Pseudo Upthrusts.
Things to look out for in Upthrust,
1) High Volume and How high?
2. Wide Spread?
3. Close, near or on the Low?
4. What was the previous bar action
5. Did the bar into new territory?
6. Is the stock in an uptrend?
Wider the spread more potent the Upthrust .
Lower the closer the stronger the indication of weakness.
If the close is towards the middle it would mean than the SM was not successful in marking the price down. There was too much demand.
***The next bar after the Upthrust is very important. That helps us decide our action.***
Upbars with high volume with narrow spread and closing in the middle or low indicates that supply is swamping the demand. This kind of bars would normally be seen near resistance lines. This by itself does not portend great weakness. But the following bars would indicate whether the supply is persisting or not.
No Demand Bar
No demand bar is a Upbar with narrow spread closing in the middle or lower and the volume is less than the volume of the previous bars. A No Demand bar indicates that there is no support from the SM.
***While analyzing a No demand bar we have to look at the prevailing background.***
If the background does not show weakness the No demand bar does show weakness and does not necessarily Indicate reversal. It only shows lack of participation from SM. We may soon see the SM moving in to take the stock up further.

Testing for Supply
The Testing for supply is done by rapidly marking down the price.
If the stock recovers towards the high and the volume is low it would mean that there was no supply.
If the volume is high and if the stock fails to recover it would mean that there still supply present.
Low volume or less trading activity indicates a successful test.
A TEST bar typically dips into a previous high volume area and recovers to close near the high on low volume.
If there has been absorption volumes just before the Test bar the strength of the test bar becomes more significant.
Stopping Volume – normally in downtrend
Down bar with high volume bar closing on the upper side. This is called a Stopping volume. This indicates that the SM is absorbing all the stocks.
**An Ideal Stopping Volume bar will be down bar with high volume and closing near the top**
However most of times you would see the close on the upper half of the bar.
Reverse Upthrust
Upthrust bar we will find in a bearish move a High volume wide range up bar with the low chartering into new lows and the closing will be near the high.
The reverse Upthrust is rare and is found rarely at bottoms.
Any high volume wide range upbar in a down trend would indicate strength.
No Supply Bar:
-Indicates absence of supply and indicates strength
No Supply bar is a narrow range low volume down bar closing in the lower half.
A No Supply indication has to be read in context with background.
They indicate strength especially if they appear before/after test bars
Resistance Area and support Area
Resistance areas are zones where selling pressure increase and Support areas represent zones where buying pressure increases.
**Increased volume with increased spread as the stock approaches a resistance area is a bullish sign.
Falling volume and decreased spread would mean that stock would be stalled at these areas.***
**Decreased volume and spread as the stock approaches support area is sign that the stock would take support in that area and reverse.
Increased volume and spread would indicate that chances of the stock breaking the support are more.**
RETRACEMENT,
1. Lack of volatility
2. Small spreads
3. Decreased Volume
REVERSAL,
1. Increased Volatility
2. Large spreads. Especially Effort to Fall bars.
3. Increasing volume
Saturday, 7 February 2015
Volume Spread Analysis
Dear Fans and Readers of SGWiseInvestors,
Sorry for not posting on the blog so regularly. SGWiseInvestors are in discussion with some companies on expansion and is working out something for readers and fans of SGWiseInvestors. Followers know that for SGWiseInvestors, we look into volume and price for validation and whether if the market is acting normally. This is basically the cause and effect rules.
SGWiseInvestors is looking into creating Passive Income for Punters/ Short Term Trader and will like to take this chance to introduce Volume Spread Analysis to the public. This is not something new for most traders but most traders are only using simple technical analyst for prediction of the market. This is simply not enough for one to make consistent profit.
Why Volume Spread Analysis?
This technical analysis is to follow where the Smart Money is. If you follow Smart Money, you will always be sure that your money is safe and there is greater assurance that the stocks, currency pair will move to your favorable position. However this method takes a lot of training and also time to spot the movement. SGWiseInvestors are catering this wants and needs to people who are keen to make SERIOUS MONEY. Your question will be " will it be a scam? will it be expensive?". We are trying to get the software at a cheaper deal for our members and we are still in the midst of discussion. If I am to tell you that the price of the software is only a small amount for USD400 for life membership and you can have the "Live" forex trading platform for life. Pros is that there is unlimited upside for profit. Be assured that your small investments will makes multiple folds of profit and you are on your way to financial freedom. what is the cons? you lose that USD350.
What is Volume Spread Analysis?
Most traders are aware of the two widely known approaches used to analyze a market- fundamental analysis and technical analysis. Many different methods can be used in each approach, but generally speaking fundamental analysis is concerned with the question of why something in the market will happen, and technical analysis attempts to answer the question of when something will happen. Volume Spread Analysis, however, is a third approach to analyzing a market. It combines the best of both fundamental and technical analysis into a singular approach that answers both questions of 'why' and 'when' simultaneously.

We will unleash the power of VSA to you in the next review. Stay Tune
Sorry for not posting on the blog so regularly. SGWiseInvestors are in discussion with some companies on expansion and is working out something for readers and fans of SGWiseInvestors. Followers know that for SGWiseInvestors, we look into volume and price for validation and whether if the market is acting normally. This is basically the cause and effect rules.
SGWiseInvestors is looking into creating Passive Income for Punters/ Short Term Trader and will like to take this chance to introduce Volume Spread Analysis to the public. This is not something new for most traders but most traders are only using simple technical analyst for prediction of the market. This is simply not enough for one to make consistent profit.
Why Volume Spread Analysis?
This technical analysis is to follow where the Smart Money is. If you follow Smart Money, you will always be sure that your money is safe and there is greater assurance that the stocks, currency pair will move to your favorable position. However this method takes a lot of training and also time to spot the movement. SGWiseInvestors are catering this wants and needs to people who are keen to make SERIOUS MONEY. Your question will be " will it be a scam? will it be expensive?". We are trying to get the software at a cheaper deal for our members and we are still in the midst of discussion. If I am to tell you that the price of the software is only a small amount for USD400 for life membership and you can have the "Live" forex trading platform for life. Pros is that there is unlimited upside for profit. Be assured that your small investments will makes multiple folds of profit and you are on your way to financial freedom. what is the cons? you lose that USD350.
What is Volume Spread Analysis?
Most traders are aware of the two widely known approaches used to analyze a market- fundamental analysis and technical analysis. Many different methods can be used in each approach, but generally speaking fundamental analysis is concerned with the question of why something in the market will happen, and technical analysis attempts to answer the question of when something will happen. Volume Spread Analysis, however, is a third approach to analyzing a market. It combines the best of both fundamental and technical analysis into a singular approach that answers both questions of 'why' and 'when' simultaneously.
We will unleash the power of VSA to you in the next review. Stay Tune
Review of market - 07 Feb 2015
Dear Fans and Readers for SGWiseInvestors,
Yesterday market has hit all time high. this is boosted by the U.S. jobs created at fastest pace since 1997.
We can see that the market is taking this chance to offload their holdings for Short Term gain.
This is a bad sign for Short Term Long holders. Beware!!! On monday, we may see continuation of the start of downtrend to 17200. Volume has validate the downtrend. RSI has also showed it stalling at 55.77. If the market is up on monday, buyers can continue buying as the momentum has resume to the upside. Currently we should see it now favorable to the downside.
INDU

NASDAQ

Yesterday price action has proven to be bearish. Volume is not low and RSI is pointing to the downside. Beware for further downside.
XAUUSD

Yesterday big down bar is extremely bearish. RSI is pointing to the downside. However do note, the downtrend is still intact. If monday there is a spike up, we are still in continuation to the upside for the Short Term.
BRENT

Brent is going up? From the look of it. It is going to reverse soon. Why? Volume is down with the continuation of the upside. This will not move up for long. It is good to short some stocks like BP etc
which has link with Crude Oil.
Yesterday market has hit all time high. this is boosted by the U.S. jobs created at fastest pace since 1997.
We can see that the market is taking this chance to offload their holdings for Short Term gain.
This is a bad sign for Short Term Long holders. Beware!!! On monday, we may see continuation of the start of downtrend to 17200. Volume has validate the downtrend. RSI has also showed it stalling at 55.77. If the market is up on monday, buyers can continue buying as the momentum has resume to the upside. Currently we should see it now favorable to the downside.
INDU
NASDAQ
Yesterday price action has proven to be bearish. Volume is not low and RSI is pointing to the downside. Beware for further downside.
XAUUSD
BRENT
Brent is going up? From the look of it. It is going to reverse soon. Why? Volume is down with the continuation of the upside. This will not move up for long. It is good to short some stocks like BP etc
which has link with Crude Oil.
Tuesday, 27 January 2015
Company round up for 27Jan2015
Lets do a round up for Company.
MSFT - Microsoft
On the 27 Jan 2015, this company announced that the estimates are in line with the expectation. However, market perceived that as bad news and after hour we saw a sell-down.
The chart shows a Dragonfly Doji. There are a lot of buying from the public. A lot of bullishness in this stock. Volume is high and it ends on the upper wick. We should see this stock absorbing all the stocks from the weak hands and should see it going up higher soon.

YHOO - Yahoo
The charts show strength and it is making higher low. RSI shows that it is now at 52.78. It has to break resistance at 50SMA in order for a lesser risk entry. Today is the announcement for earnings, tax plan, etc. From the chart, we should be expecting some good result.

AAPL - Apple
Chart looks good. Volume is increasing as it is marched higher. Looking at the chart, we should be expecting good result. Will see 118 soon.
BABA - Alibaba
Alibaba is looking good. It is consolidating near the resistance level and it seems like good news is on the way for this stock. This stock will drag Yhoo to the upside.

INTC - Intel Corp
The chart is showing bearishness and also consolidating. RSI dipped below the support and seems like the momentum is going downhill. Should the support break at the previous RSI 35, we should see it heading towards below 10.

MU - Micron Technology. Inc
Currently MU is still not able to shoot pass the 200SMA at 31.26. This will be a good entry point if we see strength. Volume is decreasing as it move higher. This may prove to me a temporary upside before it goes down to 27.

Market Analysis for 27Jan2015
Dear SGWiseInvestors Fans and Readers,
The market will not slump, thanks to ECB Draghi QE. This is extremely good news for equities market as we have witness the power of QE. Buy in Dip strategy is still in the play.
INDU
We are experiencing consolidation at the moment. 10SMA and 30SMA are currently showing that it is more favourable towards downtrend. If the market is to dip, strong support will be at 17,039. Yesterday price action is very bullish. Indicating that today the market will open green.

NASDAQ
We should be experiencing bullishness in Nasdaq stock market. The market is currently making higher even though 10SMA and 30SMA are currently showing that it is more favourable towards downtrend. With more earnings like Microsoft, Yahoo, APPLE making announcement, we should see Nasdaq making new high if favourable results are to be announced.

Gold
Gold is likely to dip in near term till it reached about 1,255-1,270 support.
Do accumulate some if you have not as it is at strong uptrend.

BRENT
A lot of fan/readers ask me if bottom has been reached. My answer is temporary bottom has been reached as the chart is showing consolidation. I believe that it may consolidate for a while as I do see a lot of buying at the moment. Fast punter may like to consider counter trade. Buy at about 45 and sell it anytime higher.
Subscribe to:
Comments (Atom)