Showing posts with label DJIA. Show all posts

Friday, 26 December 2014

Sector Reviews after X'mas Rally

Dear SGWiseInvestors Fans and Readers,

Merry Christmas! The Christmas rally as predicted did come true. Now the market is experiencing low volume rally to the New Year. Emails received asking if when can they short the market. Not now. The price action and volume indicate we will have the rally till next week. There is no selling climax behind the scene thus we can expect more rally to come. RSI and price action indicate that there is still room for more upwards and momentum of the trend is strong. 
Market Level

INDU – DOW Jones
Going up?


NASDAQ

Upward trend?Nasdaq is now at the support of the RSI at 57.85. We can see that it is moving sideway. We hope to see the trend curling upwards to indicate more momentum. MACD is indicating that there will be a crossover. This meaning BUYING SIGNAL will be triggered for MACD users.  We forecast that the Nasdaq will breakout at 4800 and more upward movement in weeks or even days to come.


Sector level

From the graph that we attached for the overview of the market sectors. We can say that the strongest is utilities. Energy sectors is not a pick now. From the chart below, there is a high chance that it will not bypass the 200SMA hurdle. We should see it going down soon unless volume is there to push the prices higher. Health care looks good as it has met its support at near 200SMA and this seems like it is rebounding to higher high soon. Material is having a Doji which means that there may be no buying coming and may see a retracement soon for buying to comes in. The rest of the sectors looks promising .. every dip is a buying opportunity.


Friday, 19 December 2014

Market Condition

Dear SGWiseInvestors Readers and Fans,

Sorry if the blog is not updated daily as I have been observing what the Smart Money is acting behind the scene. I observed on the thanksgiving day that there are offloading of equities. But on short term trading methodolody, it will be bullish till end of the month. We may even hit all year high by Jan 2015. In our previous blog, we indicated that this week is the crucial week and will likely see the reversal after the speech by FED, Yellen on Wednesday. Indeed yesterday rally is impressive with 213 points gain. Momentum is up and there is a lot of buying with volume going higher. There is not much selling judging on the upper wick of the candle. 

Fans from Stocktwits came and ask me for my opinion on the market. If you read my blog regularly, it was written black and white that Wednesday or Thursday is the reversal day.  Indeed it came true and you will know the accuracy that we have in the stock market. Investors have to obey the rules and not let your emotions run wild (talk is easy but this comes with clear mind and trading discipline which may takes years to cultivate). Today is also a good time to enter the stock market as the run will last till Jan 2015. 


From the below chart/diagram, we can see that the one that is currently the market is more bullish in Nasdaq than Dow Jones. Thus we will look at the top runners yesterday later and we will be able to distinguish the leading company for yesterday ‘s run. Those that rally the most yesterday will be the one that continue to rally more than other companies today (*normally).


Sectors


We have attached the above charts for your analysis. We can see that all the industrials have hit the support line and followed by white candle. Yes we are going for the bounce. The selloff in Energy sector recently has led the Dow Jones. This is the leading sector for yesterday. Cyclical, Material and Health has been holding up well and they are the sectors that did well yesterday. The second diagram shows the period from 06 Mar 2014 to 17 Dec 2014 of which sectors perform the best for LONG TERM Investors.


From the above diagram, we can see that TOP 5 is as follows. We have to look in further to see if this are the stocks that we can put it in in short term.

Tuesday, 16 December 2014

Forecast for 16Dec14

Dear SGWiseInvestors Reader and Fans,

Last week and yesterday has been a volatile week. Readers have came back and ask me if the market is going to tank or is it a buying in dip opportunity. Seriously based on my 10 over years of experience this is a buying in dip opportunity. Why? Gold is a safe heaven commodities and is a good gauge for fear. When the market is about to tank, have used this tools "Fibonacci Retracement" to determine the support and buying pressure that may come in. Yesterday was a test of 61.8% support at 17,169. There is selling pressure that pushes the market to low of 17,115 and closes at 17,180. If today the market holds at this support (which is unlikely), we should be heading up for a rally. 
I believed that we should be testing at 50% support 16,915. I can see that RSI is indicating that there are still some room for one or two more falls and we are heading for Christmas Rally. I do note there will be FED meeting this Thursday and this may be a triggering point for the rally. FED may announce something doverish to boost the market and to lure more traders into the market. (they cannot possibly scare all investors out of the market, then how are they going to make money). 
I do notice that Dow Jones are now heavily linked with Crude Oil. There is no need for any good/bad news to be catalyst. If the Crude Oil rebound, the stock market will re-live. But whether if it is short lived or not, let the volume tells you.

Dow Jones – Where are we heading?


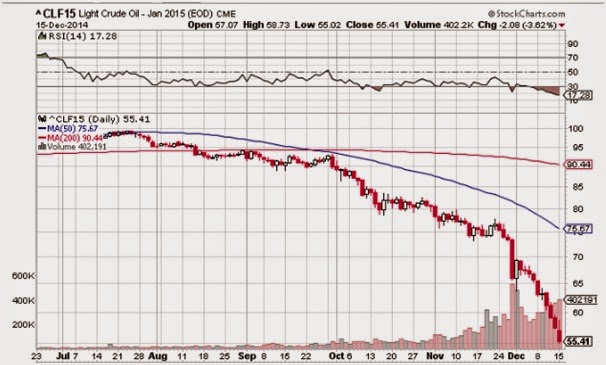
CLF15 – Light Crude Oil


Commodity Crude Oil is the culprit for bringing down the whole stock market. The above chart show a nice downtrend since 06 Oct 2014. This is accompanied by increase in volume. Technically this means that there are genuine selling by Smart Money and they have not seen the price that they want yet. Thus there is no rebound or up candle stick. Target Price for Crude Oil should be around USD48. That will be one big strong support that we are looking at. Currently we can say that downside are more favourable in the short run until good news/ announcement comes in.  


Gold – Is it heading North or South?


Gold from the above chart shows that it is currently on the uptrend. This is probably due to increase in fear from Crude oil commodity bringing the stock market down. Yesterday decrease of about 29 points is currently in the support of 30SMA support. We should see absorption volume coming in at this point if the upside will to resume. Else we should see it retesting 1140 soon.


Daily Chart and Weekly Chart for $Brent is attached. Currently the daily chart and weekly chart is showing that it is overbought. There is no floor yet thus there is no indication where is the bottom. Yesterday increase in volume in selling indicated that there are a lot of people selling their shares. We can say that there are increase down pressure as indicated from the volume. Whether when will we reach the bottom, only volume and price action will tells.

Saturday, 6 December 2014

Dow Jones for 09 Dec 2014 to 12 Dec 2014


Dow Jones end the week on a positive note when Non-Farm Payroll report comes in strong. Overall still uptrend. We should see this resuming. To see the short term NYA index I am able to see the market breadth that novice trader does not know. We are going side-way. We need a breakout out of the triangle with good volume. Do note that December is a month where we likely see volume lower than usual as Traders went for holiday. 


Sector for Strength – Which Sector?


The above analysis is so good and easy to read. We can see that Health, Financials, Consumer Discretionary is leading the Dow Jones. We can see that XLE (Energy) has lagged from “Improving” to “Losing”. Weakening sectors in Dow Jones are Material, Technology and Industrials are the sector that we should not entering. This is just a guide. Do note that in the market anything will change. We have to look at the charts for any of the company to make any decisions.


Which is the Stocks in Dow Jones is performing and has strength?
 

I was going through the list and I think I should share in the blog. I can say that the Visa has been performing very well. It has increased by 24.5% and this is the kind of stock that we should be trading. Least performing stock is IBM. This kind of stock is meant to short for max game.

Tuesday, 25 November 2014

Health of Dow Jones and Sectors

Hello Fans of SGWiseInvestors. Good Day to you. Yesterday was a plain day. It started strong and ended with a Doji candle. 

What does 24 Nov 2014 chart says??

DOW JONES


Yesterday action is a battle of the BULL against Bear. From the first chart, DOW JONES is moving to higher low and NYMO shows that there are still room to climb before it dips. Volume does not justify for the move upwards and we will like to see more volume coming in to push the market higher. It is coming to Dec. Do note that Traders are closing their account soon and going for holiday. We can expect market to climb higher with lower volume. This is basically pushed by retailers.


Let's look at the overall health of US market. I got this chart from StockChart and I find that it is a good chart to have to see the overall health of the market. From the chart above, we can see that $INDU (Dow Jones) are improving and it is leading. This is the market where you want to go long.
Do remember to check the health before you trade in that market.


Which Sector is the strongest to Trade?


When a Trader of Swing position like to trade, he will like to know health of the market.
Follow by the sector. Now let me touch on the sector. We can see that the strongest is Health Care, Technology and consumer staples. If the market turn bearish, you should be looking at cyclical and Energy Stock. This is because you will want the maximum gain.

Sunday, 23 November 2014

Dow Jones Movement Forecast

VIX – VOLATILIY CHART


A lot of fans from Stocktwits message me to ask whether if the DOW JONES is up or down next week? I wrote on the forecast on the Dow Jones and advise that Dow is strong and will continue to be stronger till end of the Dec 2014. Given the recent news on Friday that BOE is already executing Assets Buying Program, we can expect market was given a further boost. From the above VIX chart, we can see that RSI is currently 31.04. we can expect stock to go OVERBOUGHT. (ie VIX to go Oversold)
VIX is currently at support and if RSI goes oversold. We will look at the candle and strength behind. The Strategy will be to go Short on Stocks if the bar goes below EMA 10.  Include this in your trading Strategy and will see a big change in your account $$ numbers. Remember this is on MACRO view. Thereafter you should look at which is the sectors that is the strongest, follow why which company is the strongest.

VIX (MACRO View) -> Sector -> company ==รจ to give max gain.


Will DOW Jones Crash? If YES, When??
Short Term

NYSE Composite Index shows that in the Short Term we are going higher. We can see that NYMO has bounce of O and is heading towards 75. Volume increase as price is going higher. This is accompanied with the increase in body of the candle. We can say there are strength behind.

Short Term look shows that there is no divergence and between NYMO and NYA. There are constant buying and we should take note once NYMO reaches 50 to 75. There may be noises behind and creates more dip for buying opportunity. This is the SANTA CLAUS RALLY that I am referring to.


Long Term


The NYSI and NYA is showing chart for long term view. I will use this to predict Crashes. I remember the days in 2007-2008 crash. There are so many optimism on the economy. However NYA and NYSI shows otherwise. It is showing that SM are offloading months before the big crash. I am glad that during that time I am able to spot the offload and get off with small profit else I will only harbor on to hope and all my hard earn money will donate to Smart Money’s pocket.
Above shows that Long Term view there is nothing abnormal behind the scene. The NYA chart shows that the bars increase with high volume. NYSI correspond to the NYA movement. Thus Long Term still bullish at the moment.
Do not listen to Media , Hedge Fund Manager etc saying that Dow Jones are crashing. They work hand in hand to create fear and volatility to the market. This is what I called Trading Psychology. I will like to see the response from my readers if they enjoy my article and if they like me to cover that topic.

For the meantime,
Good Luck, Happy Reading and Best of Luck for Monday Trading.


From SGWiseInvestors